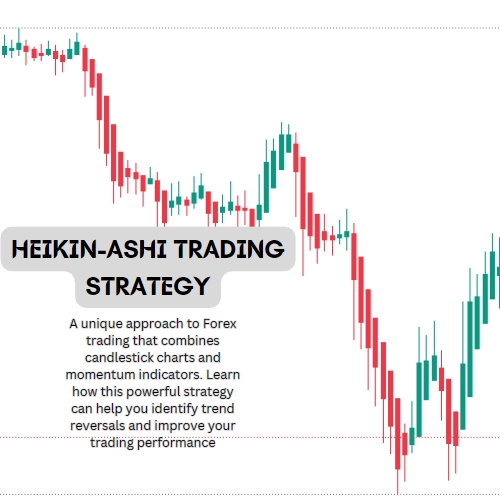
Showing posts with label Trading Strategies. Show all posts

Wednesday 28 June 2023

Mastering the Stochastic Oscillator: A Comprehensive Guide to Enhance Your Trading Strategies

Learn how to effectively use the stochastic oscillator as a technical analysis tool to identify market reversals and make informed trading decisions. Enhance your analysis and gain a competitive edge in the stock market.


The widely used technical analysis tool that helps traders assess overbought and oversold conditions in the market and identify potential trend reversals. In this comprehensive guide, we will delve into the concept of the stochastic oscillator, its calculation, interpretation, optimal settings, and practical applications in trading strategies. By understanding the nuances of this powerful indicator, traders can enhance their analysis and make more informed decisions in the dynamic world of the stock market.

What is the Stochastic Oscillator?

It is a momentum indicator that compares the closing price of an asset to its price range over a specific period. It consists of two lines: the %K line and the %D line. The %K line represents the current price relative to the price range, while the %D line is a smoothed moving average of the %K line. The oscillator’s values range from 0 to 100, indicating the asset’s position within the price range.

Calculation:

To Continue Reading click here

Other Topic:

#StochasticOscillator #TradingStrategies #TechnicalAnalysis #MarketReversals #MomentumIndicator #investoropia #stock market #trading #forex #technicalindicator #technicalanalysis

The Power of Bollinger Bands: 5 Key Factors for Advanced Stock Market Analysis and Profitable Trading Strategies

Gain a competitive edge in the stock market with advanced analysis using Bollinger Bands. Learn how to calculate, interpret, and implement highly effective trading strategies for optimal profitability.


Bollinger Bands, developed by John Bollinger in the 1980s, are widely recognized as a popular technical analysis tool used by traders and investors to assess price volatility, identify trend reversals, and formulate effective trading strategies. In this article, we will delve into the concept of Bollinger Bands, including their calculation, interpretation, and various strategies for implementation.

What are Bollinger Bands?

Bollinger Bands consist of three lines plotted on a price chart: the middle band, upper band, and lower band. The middle band represents the simple moving average (SMA) of the asset’s price over a specified period, typically 20 days. The upper and lower bands are calculated by adding and subtracting a certain number of standard deviations (usually two) from the middle band.

Calculation of Bollinger Bands: Continue reading


OTHER TOPICS:

#StockMarketAnalysis #BollingerBands #TradingStrategies #TechnicalAnalysis #ProfitableTrading #investment #trading #forex #forextrading

Sunday 18 June 2023

Mastering the 5 EMA: A Powerful Indicator for Analyzing Price Trends and Making Informed Trading Decisions

Learn how to use the 5 EMA for intraday trading and enhance your trading strategies with risk-reward focus.

Media image of title of 5EMA

Technical analysis is a vital component of trading and investing decisions, allowing traders to identify trends and generate signals. Among the many indicators available, the 5 EMA (Exponential Moving Average) has gained popularity. In this article, we will delve into the fundamentals of the 5 EMA and its practical application in analyzing price trends.

What is the 5 EMA?

The 5 EMA is a moving average indicator that calculates the average price of a security over the past five periods. Unlike the simple moving average (SMA), the 5 EMA places more weight on recent prices, making it more responsive to current market conditions. By prioritizing recent prices, the 5 EMA aims to capture short-term price movements and trends more effectively.

Calculating the 5 EMA:

To calculate the 5 EMA, follow these steps:

  • Gather the closing prices of the security for the past five periods.
  • Calculate the simple moving average (SMA) of these five closing prices.
  • Determine the smoothing factor, which is typically computed as (2 / (5 + 1)).
  • Starting with the SMA as the initial EMA value, apply the smoothing factor to update the EMA for subsequent periods using the formula: EMA = (Current price - Previous EMA) x Smoothing factor + Previous EMA.

Interpreting the 5 EMA:

Traders employ the 5 EMA to identify short-term trends and potential entry or exit points.

Here's how it can be interpreted:

  1. Bullish Signal: When the price of a security is above the 5 EMA, it suggests a bullish sentiment and a potential upward trend. Traders may view this as an opportunity to buy or hold the security, expecting further price appreciation.
  2. Bearish Signal: Conversely, if the price falls below the 5 EMA, it indicates a bearish sentiment and a potential downward trend. Traders may interpret this as a signal to sell or avoid the security, anticipating further price decline.
Using the 5 EMA in Trading:

The 5 EMA is often used in conjunction with other technical indicators and analysis techniques to enhance trading strategies. Traders may seek additional confirmation before making trading decisions by considering factors such as trading volume, support and resistance levels, or other trend-following indicators.

It is crucial to acknowledge that the effectiveness of the 5 EMA, like any other indicator, can vary depending on market conditions and individual trading strategies. Traders should conduct thorough analysis, considering multiple indicators, risk management practices, and their own trading goals.

5 EMA Intraday Trading Strategy with Risk-Reward Focus:

let's explore 5EMA intraday trading strategy

5 EMA SETUP EXPAMPLE IMAGE

Strategy Overview:

Timeframes: Utilize a 15-minute timeframe for long positions and a 5-minute timeframe for short positions.

Entry Conditions:

  • Long Positions: Look for the price consistently trading above the 5 EMA on the 15-minute chart, indicating an established uptrend. Wait for a minor pullback or consolidation phase near the 5 EMA to enter long positions.
  • Short Positions: Identify the price consistently trading below the 5 EMA on the 5-minute chart, indicating a downtrend. Wait for a minor rally or consolidation near the 5 EMA to initiate short positions.

Risk Management:

  • Set a predetermined stop-loss level below the recent swing low for long positions and above the recent swing high for short positions.
  • Calculate position sizes based on risk tolerance and desired risk-reward ratios.

Target Profits:

  • Aim for a risk-reward ratio of at least 1:3, 1:5, or 1:10.
  • Determine profit targets using logical price action signals or key support and resistance levels.
  • Consider scaling out of positions and trailing stops to secure profits as the trade progresses.

It's important to note that individual traders may have different variations or preferences when using the 5 EMA in intraday trading. Traders often combine the 5 EMA strategy with other indicators or analysis techniques to enhance their trading decisions. Additionally, backtesting the strategy on historical data and evaluating its performance in various market conditions is crucial before implementing it in real-time trading. Remember to practice proper risk management and consider your own trading goals and risk tolerance when utilizing any trading strategy.

How is the 5 EMA calculated?

To calculate the 5 EMA, you gather the closing prices of the security for the past five periods, calculate the simple moving average (SMA) of these prices, and then apply a smoothing factor to update the EMA for subsequent periods.

How is the 5 EMA interpreted?

When the price of a security is above the 5 EMA, it suggests a bullish sentiment and a potential upward trend. Conversely, when the price falls below the 5 EMA, it indicates a bearish sentiment and a potential downward trend.

Can the 5 EMA be used as a standalone trading strategy?

While the 5 EMA can provide valuable insights into short-term price movements, it is often used in conjunction with other technical indicators and analysis techniques to enhance trading strategies. Traders may consider factors such as volume, support and resistance levels, and other trend-following indicators for additional confirmation.

What is an example of an intraday trading strategy using the 5 EMA?

An example strategy involves using a 15-minute timeframe for long positions and a 5-minute timeframe for short positions. For long positions, traders look for the price consistently trading above the 5 EMA on the 15-minute chart and enter during minor pullbacks or consolidations. For short positions, traders identify the price consistently trading below the 5 EMA on the 5-minute chart and enter during minor rallies or consolidations.

How should risk management be applied when using the 5 EMA strategy?

Risk management is crucial when implementing the 5 EMA strategy. Traders should set predetermined stop-loss levels below recent swing lows for long positions and above recent swing highs for short positions. Position sizes should be calculated based on risk tolerance and desired risk-reward ratios.

Can the 5 EMA strategy guarantee profits?

No trading strategy, including the 5 EMA strategy, can guarantee profits. The effectiveness of any strategy depends on market conditions and individual trading preferences. Traders should conduct thorough analysis, backtest the strategy, and consider multiple indicators and risk management practices to increase their chances of success.

What should traders consider before using the 5 EMA strategy?

Traders should consider their own trading goals, risk tolerance, and preferences when using the 5 EMA strategy. They should also conduct thorough analysis, evaluate the strategy's performance in different market conditions, and practice proper risk management. Adapting the strategy to individual needs and combining it with other indicators can further enhance trading decisions.

#TechnicalAnalysis #TradingStrategies #PriceTrends #5EMAIndicator #IntradayTrading

Sunday 11 June 2023

Heikin-Ashi Trading Strategy: A Game-Changer for trader

Discover the Heikin-Ashi Trading Strategy, a unique approach to Forex trading that combines candlestick charts and momentum indicators. Learn how this powerful strategy can help you identify trend reversals and improve your trading performance.

Master the art of Heikin-Ashi Trading Strategy and unlock a world of profitable Forex trades.

The Heikin-Ashi charting technique is a unique and popular tool used by traders in the financial markets, particularly in the forex market. It provides a different perspective compared to traditional candlestick charts and offers valuable insights into price trends and reversals. This article will delve into the intricacies of the Heikin-Ashi Trading Strategy, exploring its calculation method, advantages, and how to effectively trade with it.

Understanding Heikin-Ashi Charts:

Heikin-Ashi charts resemble candlestick charts in appearance, but their construction and plotting differ significantly. Candlestick charts display the Open, Close, High, and Low prices for each period, whereas Heikin-Ashi charts utilize calculations based on the previous candle to plot the current one. This unique approach contributes to the smoothness of the Heikin-Ashi candles and provides a different perspective on market trends.

Here is how the four components of a Heikin-Ashi candle are calculated:

  • Close price: The close price of a Heikin-Ashi candle is the average of the open, close, high, and low prices of that period.
  • Open price: The open price of a Heikin-Ashi candle is the average of the open and close prices of the previous candle.
  • High price: The high price in a Heikin-Ashi candle is chosen from the highest value among the high, open, and close prices of the period.
  • Low price: The low price in a Heikin-Ashi candle is chosen from the lowest value among the high, open, and close prices of the period.

It is important to note that Heikin-Ashi candles are interdependent as the close and open prices of each candle are calculated using the previous candle's close and open prices. Moreover, the high and low prices are influenced by the preceding candle. This interrelation between candles contributes to the smoothing effect and

Advantages of Heikin-Ashi Trading:

  • Smoothed price action: Heikin-Ashi charts are less noisy and offer a smoother representation of price movements compared to traditional candlestick charts. This characteristic helps traders identify trends more easily and reduces the impact of short-term market noise.
  • Delayed signals: The delayed signals in Heikin-Ashi charts are advantageous, especially during volatile market conditions. The delayed nature of the signals minimizes the impact of false breakouts and provides traders with a more reliable indication of trend reversals.
  • Clear trend identification: Heikin-Ashi charts make it simpler to identify trends, as bullish candles are typically marked in green and bearish candles in red. This visual clarity aids traders in recognizing trend changes and potential trading opportunities.
  • Easy recognition and accessibility: The Heikin-Ashi indicator is widely available on various charting platforms. Traders can easily access and apply this technique to their preferred trading instruments, including forex pairs, stocks, commodities, and more.

Trading with Heikin-Ashi:

The Heikin-Ashi Trading Strategy combines the power of Heikin-Ashi reversal patterns with popular momentum indicators to enhance trading decisions. Here is a step-by-step guide on how to trade with Heikin-Ashi:

  • Identify reversal patterns: Wait for two consecutive fully completed candles (either bearish or bullish) on the daily chart to confirm a reversal pattern. For instance, in a short setup, look for two red candles after a series of green candles, indicating a potential exhaustion of the uptrend and a possible reversal. Similarly, in a long setup, watch for two consecutive green candles after a series of red candles, suggesting a potential end to the downtrend and a reversal.
  • Apply a momentum filter: To further improve the accuracy of the strategy, consider using a momentum indicator such as the Stochastic Oscillator with settings (14, 7, 3). The Stochastic Oscillator measures the speed and magnitude of price movements, offering additional confirmation for trade entries.
  • Filter out false signals: While Heikin-Ashi reversal patterns are powerful, it is crucial to implement additional filters to minimize false signals and enhance performance. The Stochastic Oscillator serves as a valuable filter in this strategy, providing an extra layer of confirmation for trade setups.
The Heikin-Ashi Trading Strategy is a powerful approach for traders in the forex market. By incorporating Heikin-Ashi charts and combining them with momentum indicators like the Stochastic Oscillator, traders can improve the accuracy of their trading decisions. The strategy's advantages, including smoothed price action, delayed signals, and clear trend identification, have contributed to its popularity among forex traders. However, it is essential to practice proper risk management and thoroughly backtest the strategy before applying it to live trading.

1. What is Heikin-Ashi Trading Strategy?

Heikin-Ashi Trading Strategy is a unique approach to analyzing and trading financial markets, particularly in the forex market. It involves using Heikin-Ashi candlestick charts, which differ from traditional candlestick charts in terms of how the candles are calculated and plotted.

2. How does Heikin-Ashi differ from regular candlestick charts?

In Heikin-Ashi charts, each candle is calculated based on the average of the open, close, high, and low prices of the previous candle. This results in smoother-looking candles that can help traders identify trend reversals and reduce noise in price movements.

3. Why is Heikin-Ashi Trading Strategy popular among traders?

Heikin-Ashi Trading Strategy is popular among traders due to its ability to provide clearer signals and reduce market noise. The delayed nature of Heikin-Ashi charts can be advantageous in volatile markets, and the strategy is relatively easy to understand and implement.

4. What are the key components of the Heikin-Ashi Trading Strategy?

The Heikin-Ashi Trading Strategy combines the use of Heikin-Ashi reversal patterns with popular momentum indicators like the Stochastic Oscillator. By identifying specific candle patterns and confirming them with momentum indicators, traders can make more informed trading decisions.

5. How can I trade with the Heikin-Ashi Trading Strategy?

For short setups, traders look for two consecutive red candles after a series of green candles, indicating an exhausted uptrend and potential reversal. Conversely, for long setups, two consecutive green candles after a series of red candles suggest an exhausted downtrend and potential reversal.

6. Are there any filters or additional indicators to enhance the strategy?

Yes, to improve the performance of the Heikin-Ashi Trading Strategy, it is recommended to use additional filters. One popular filter is the Stochastic Oscillator with settings (14,7,3), which helps confirm the strength of the reversal signals.

7. Can I use the Heikin-Ashi Trading Strategy in other financial markets?

While the Heikin-Ashi Trading Strategy is commonly used in the forex market, it can also be applied to other financial markets such as stocks, commodities, and indices. Traders can adjust the timeframes and indicators according to the specific market they are trading.

8. Is the Heikin-Ashi Trading Strategy suitable for all types of traders?

The Heikin-Ashi Trading Strategy can be utilized by various types of traders, including day traders and swing traders. It is important to adapt the strategy to your trading style and risk tolerance and perform thorough backtesting and analysis before implementing it in live trading.

9. How can I access Heikin-Ashi charts for my trading analysis?

Heikin-Ashi charts are widely available on most charting platforms and trading software. Traders can easily access and apply Heikin-Ashi indicators or select Heikin-Ashi as the preferred chart type to analyze price movements.

10. What are the potential risks associated with the Heikin-Ashi Trading Strategy?

Like any trading strategy, the Heikin-Ashi Trading Strategy is not without risks. Traders should be aware that no strategy guarantees profits, and losses are possible. It is essential to combine the strategy with proper risk management techniques and continually monitor market conditions.

Please note that the answers provided above are for informational purposes only and should not be considered as financial advice. Trading in financial markets carries risks, and individuals should conduct thorough research and seek professional guidance before making any trading decisions.

#ForexTrading #TradingStrategy #HeikinAshi #CandlestickCharts #MomentumFilters #TrendReversals #TechnicalAnalysis #investoropia

Unlock the Secrets of Credit Scores: The Ultimate Guide to Financial Freedom!

Learn the key factors influencing credit scores and gain insights on building and maintaining a healthy credit profile.   IN today’s modern ...